RELIABILITY
RELIABILITY
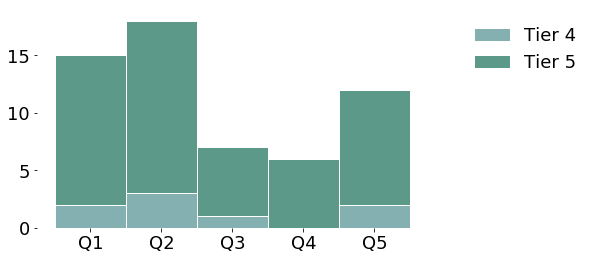
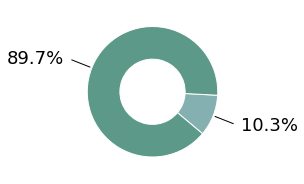
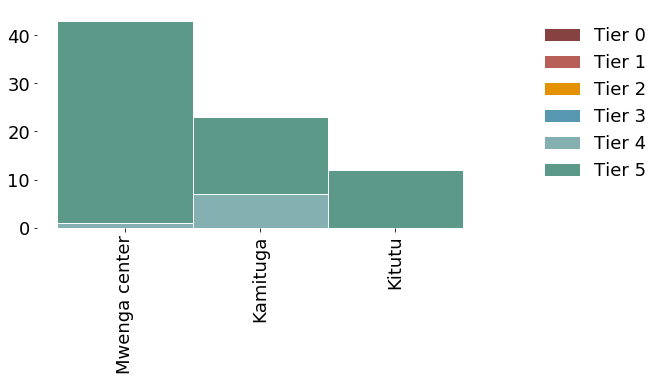
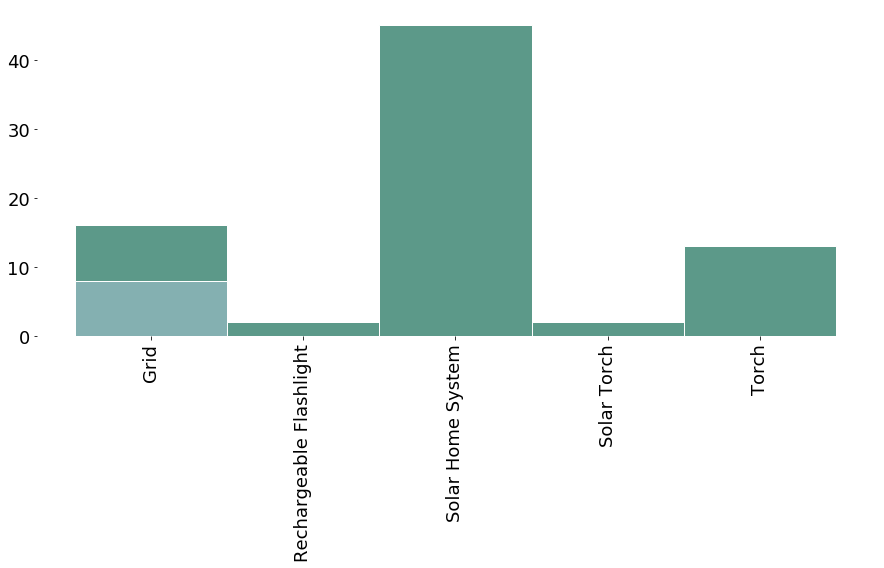
Reliability only applies only to households with electric grid connections and is based on the number and duration of power cuts. There are 3 possible tiers: 3, 4, & 5. Households in Tier 4 experience 14 or less power cuts per week, whereas households in Tier 5 have a maximum of 3 power cuts of less than 2 hours each per week. In Tier 3, households have more than 14 power cuts per week.
HIT_PATH = '../../../../src/'
institution_id = 7
lang = 'en'
import os,sys, folium
sys.path.insert(0, os.path.normpath(os.path.join(os.path.abspath(''), HIT_PATH)))
import hedera_types as hedera
import odk_interface as odk

mfi = hedera.mfi(institution_id,setPathBook=True)
data = mfi.read_survey(mfi.odk_data_name)
mfi.HH = odk.households(data)
attribute = 'E_Reliability'
import matplotlib.pyplot as plt
plt.rcParams.update({'font.size': 18})
mfi.tier_pie(attribute)
import matplotlib.pyplot as plt
plt.rcParams.update({'font.size': 18})
mfi.stacked_tier_per_category(attribute,mfi.offices,
                              'locality',
                              mfi.offices,legend=True)
import matplotlib.pyplot as plt
plt.rcParams.update({'font.size': 18})
mfi.stacked_tier_per_category(attribute,hedera.keys().powerSources,
                              'primary_electricity_source',
                              hedera.names('en').powerSources)
import matplotlib.pyplot as plt
plt.rcParams.update({'font.size': 18})
mfi.tiers_per_quintile(attribute,legend=True)