Field Research in Kenya
Energy access is multidimensional. In order to quantify and address energy demand and energy needs of the rural population, it is highly necessary to implement tools that are not limited to a purely binary assessment (household connected/not connected to the grid). Assessing energy needs shall take into account a wider range of attributes, measuring energy access in terms of affordability, reliability, quality, and safety of energy, as well as include the possibility of using modern and alternative sources (e.g., solar home systems, mini-grids). The purpose of this study was to assess energy access of 137 households in the region of Arequipa (Peru). The approach implemented is based on the Multi-Tier Framework (MTF), developed by The World Bank.
The objective of this project is to analyze the access to energy (electricity and cooking solution) in a rural area of Kenya. The research has been conducted by Hillary Kipcoech Korir, a master student at the Panafrican University for Water and Energy Sciences (PAUWES) of Tlemcen (Algeria).
Data collection, processing and visualization have been supported by the HEDERA Impact Toolkit Software. Relevant information concerning the use, associated costs and several attributes describing access to electricity and cooking solutions has been collected the customers of the financial institution in rural and remote areas using the App HEDERA collect. The HEDERA Impact Toolkit allows to efficiently evaluating a baseline for monitoring progress towards Sustainable Development Goal 7 following the Multi-tier Framework (MTF), recently established by The World Bank, and the Progress out of Energy Poverty Index (PEPI) N. Realpe, PhD Thesis 2017
Collection overview
Map
The Map allows to visualize the location of the collected GPS data. Missing data points are displayed with coordinated (0,0)
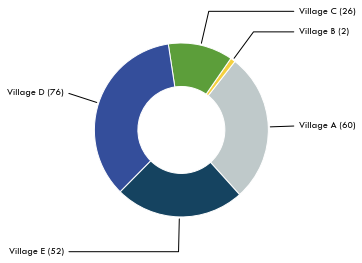
Data per location
Data have been collected in five different locations.
Access to Electricity
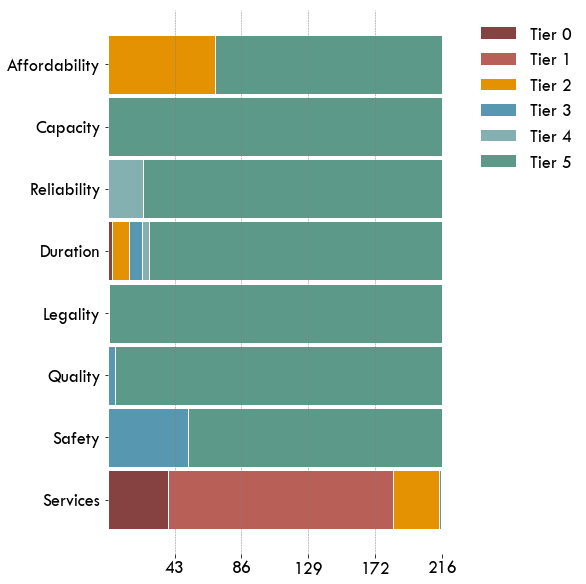
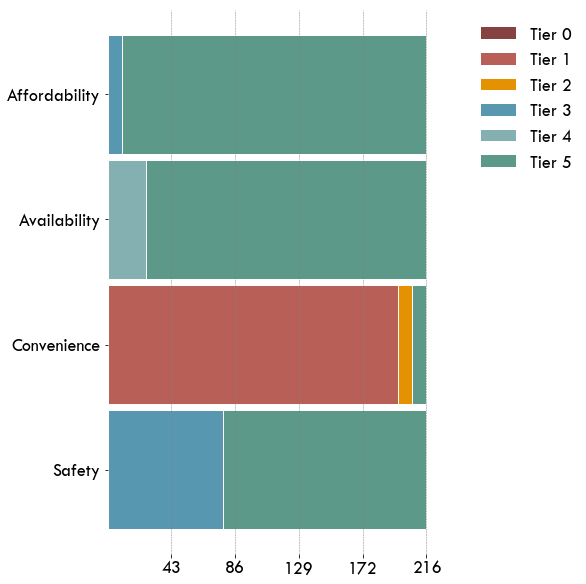
Attributes
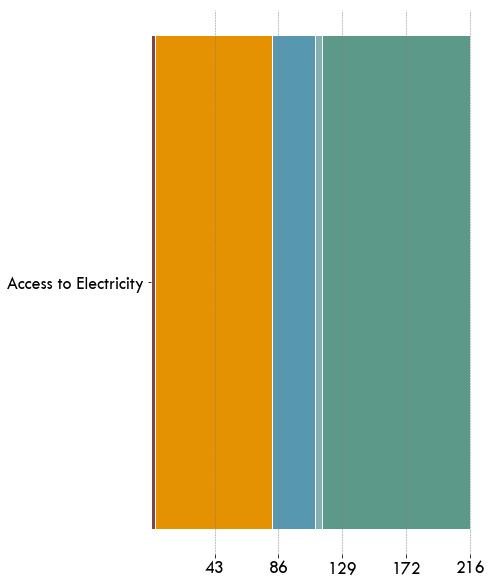
MTF Index (Access to electricity)
The MTF Index is given, for each household, by the minimum ranking among all considered attributes.
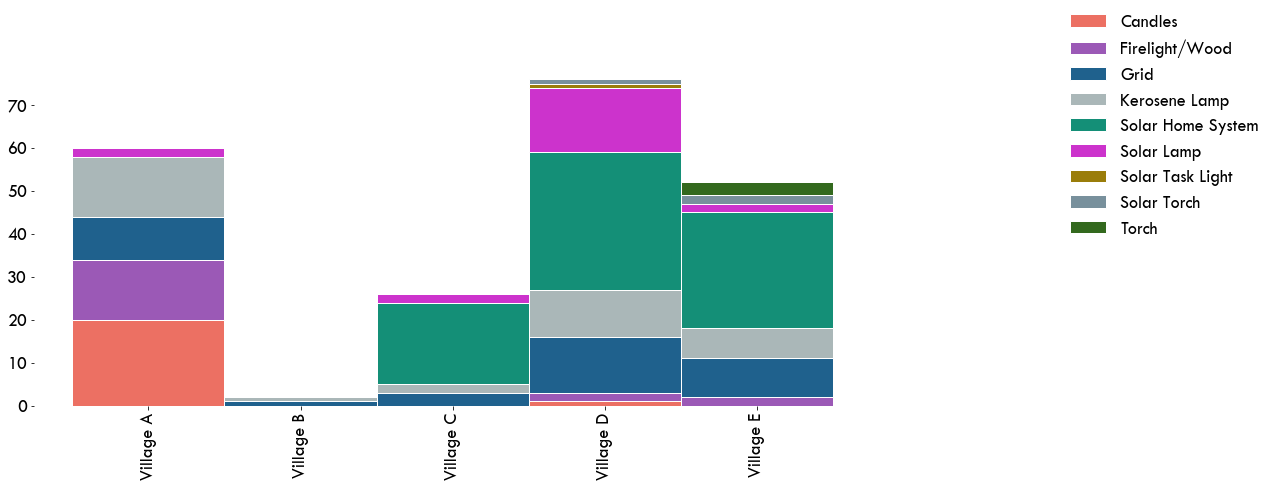
Power sources
Primary sources of electricity and illumination
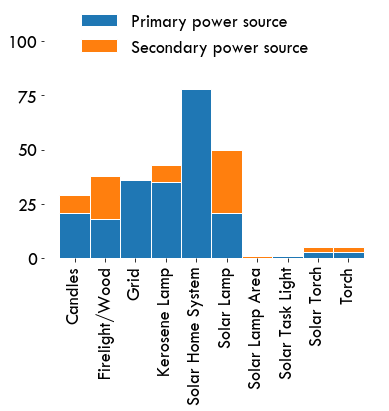
Use of Multiple Power Sources
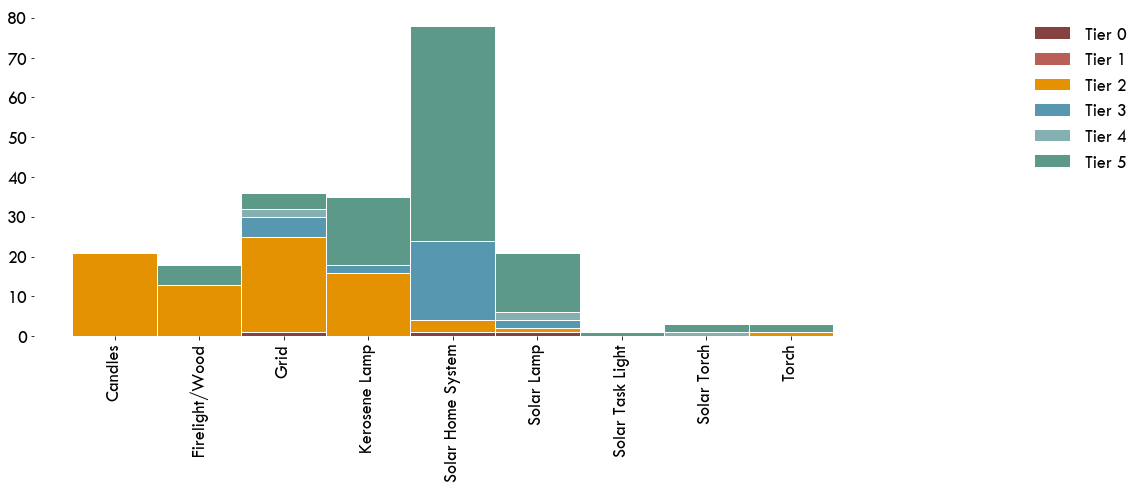
MTF Index (Access to Electricity) vs. Primary Power Source
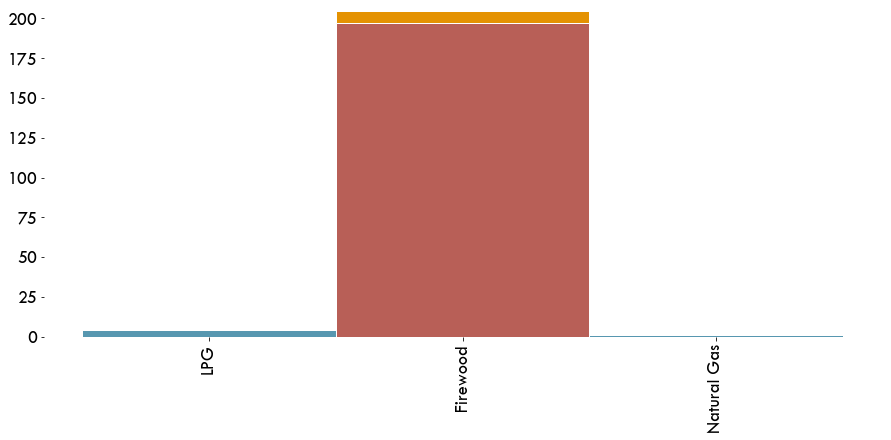
Access to Cooking Solutions
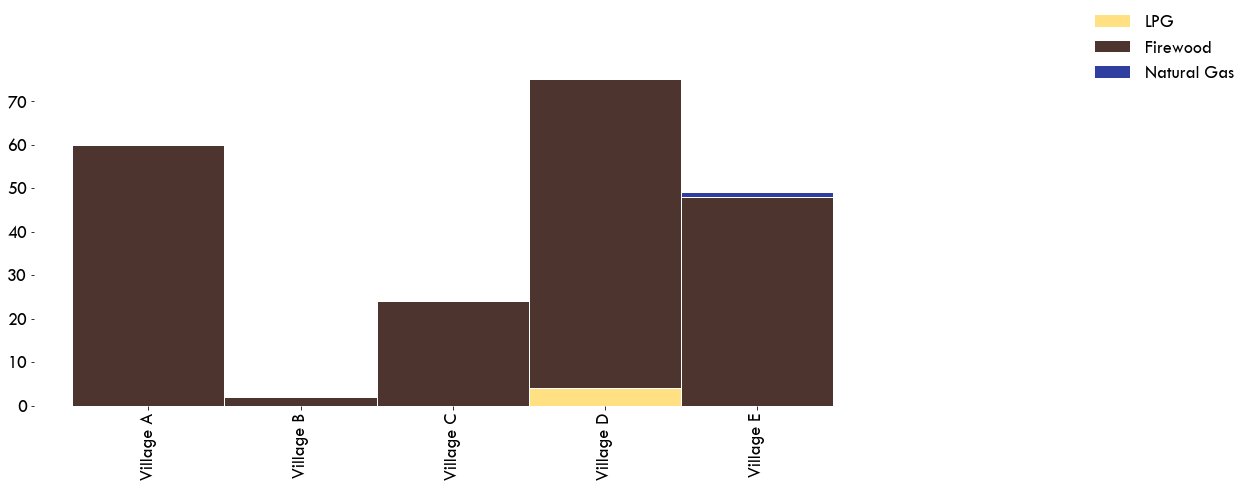
Primary Cooking Fuels
Attributed describing access to cooking solutions
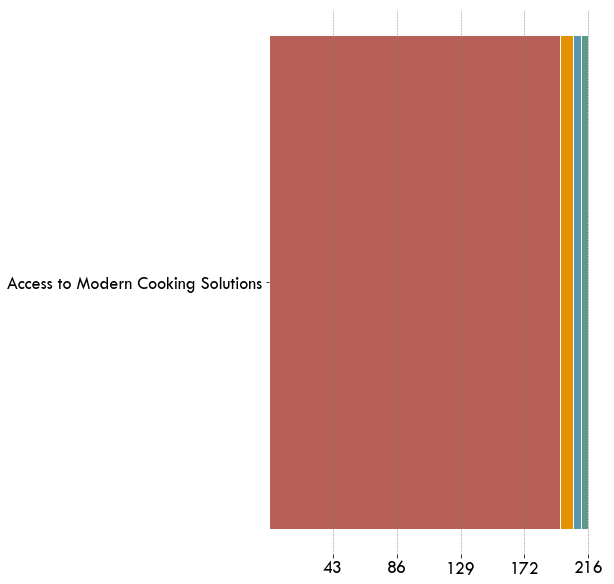
MTF Index (Cooking solutions)
The MTF Index, for each household, is given by the minimum ranking among all attributes
MTF Index (Cooking Solutions) vs. Primary Cooking Fuel